DAB stain analysis
QuArray provides the option to analyse DAB staining in exported TA images. Below is a video detailing the workflow to be applied to images that have been exported from the TA export window. There is a detailed breakdown of each window and button below.
Input
The user selects a threshold using the threshold selector window. The analysis is then applied to any PNG file in a given directory.
Selecting a threshold window
To view the threshold selector window select the threshold button from the main window. The window shown below should appear.
There is also an option to select the file path of the PNG files. Please see measurements page.
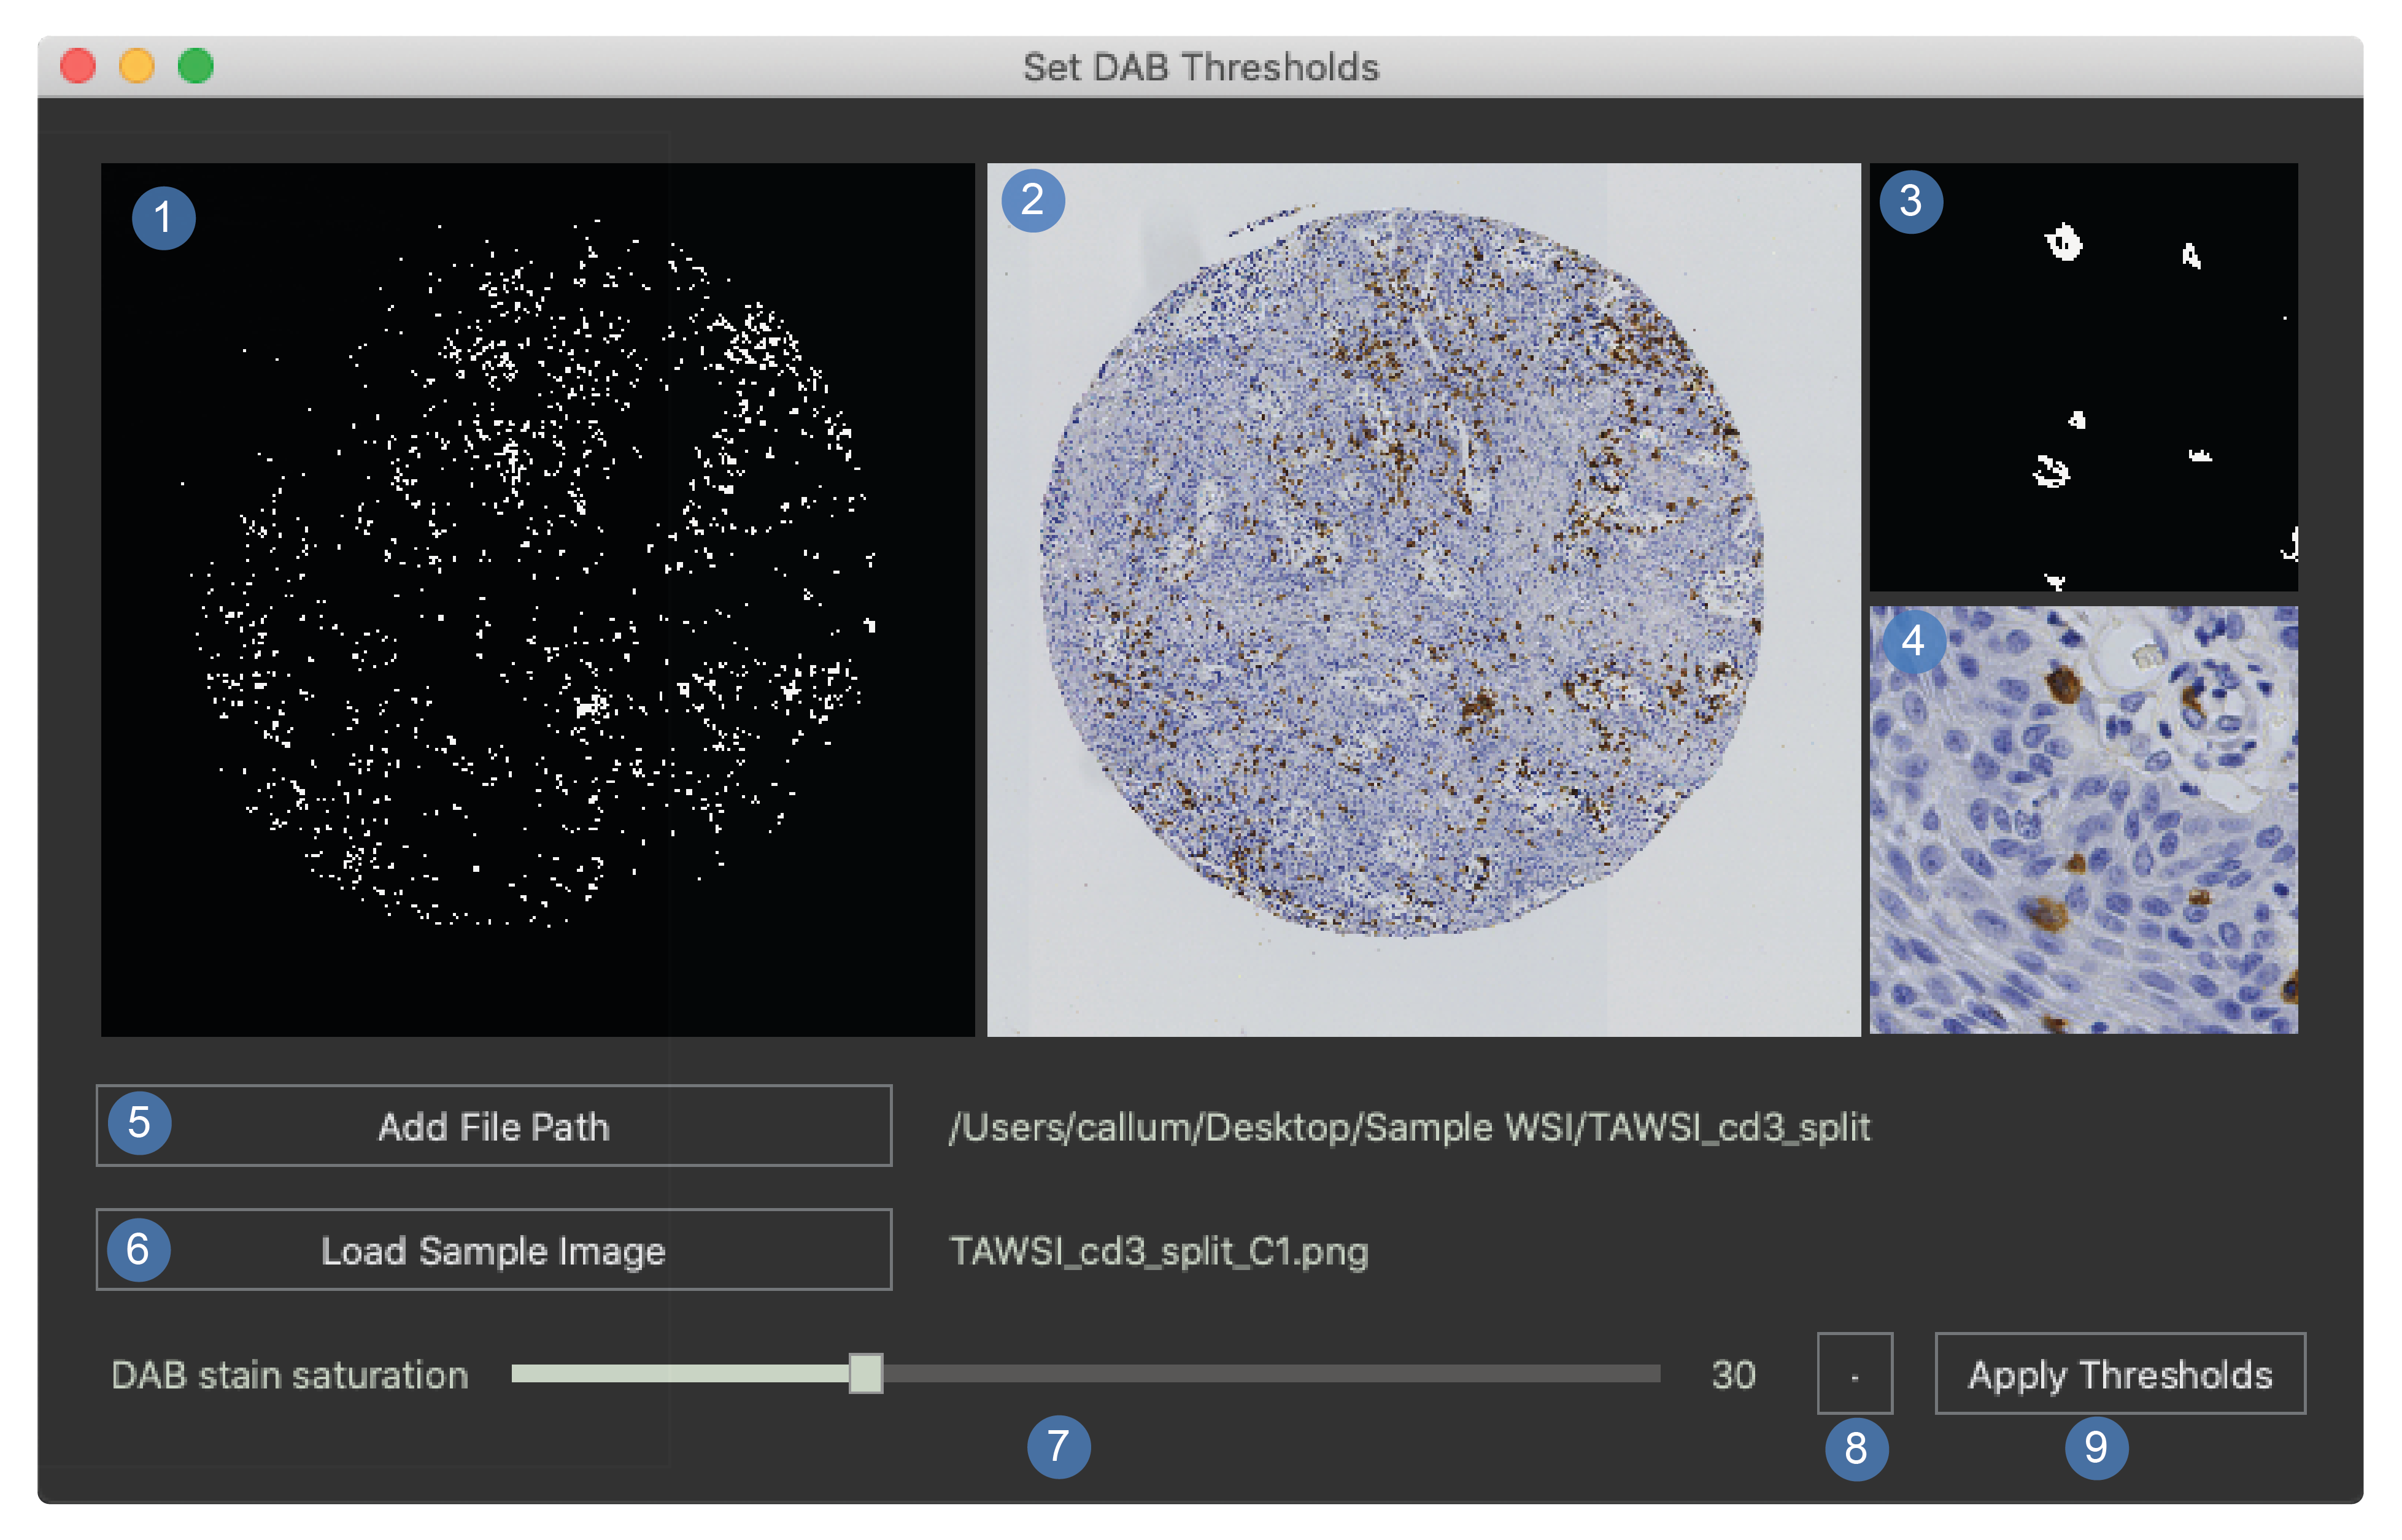
Mask for the whole image.
White pixels will be measured as stain.
This is a low-resolution version of the WSI.
Original whole image at a low resolution.
Full resolution magnification mask.
Full resolution magnification image.
Add a file path.
This is used to select the directory containing the PNG images that will be used to optimise the threshold.
A random image from this file will be loaded into the window.
Load sample image.
This will load a new random image into the window.
It is good to optimise the thresholds on at least 10 sample images from the dataset.
Saturation slider.
This will change the minimum saturation value for the DAB stain.
The value will be displayed in windows 1 and 3.
Toggle button which shows the original image again and it is now depreciated due to the extra windows.
Apply thresholds.
This sends the new threshold to the main window of the program.
This should be selected before pressing the DAB analysis button in the main window.
The thresholds button of the main window will turn green.
Running the analysis
This window is used for running chromogen stain analysis on exported images. This is also the landing page so the tissue array export window can be launched from here.
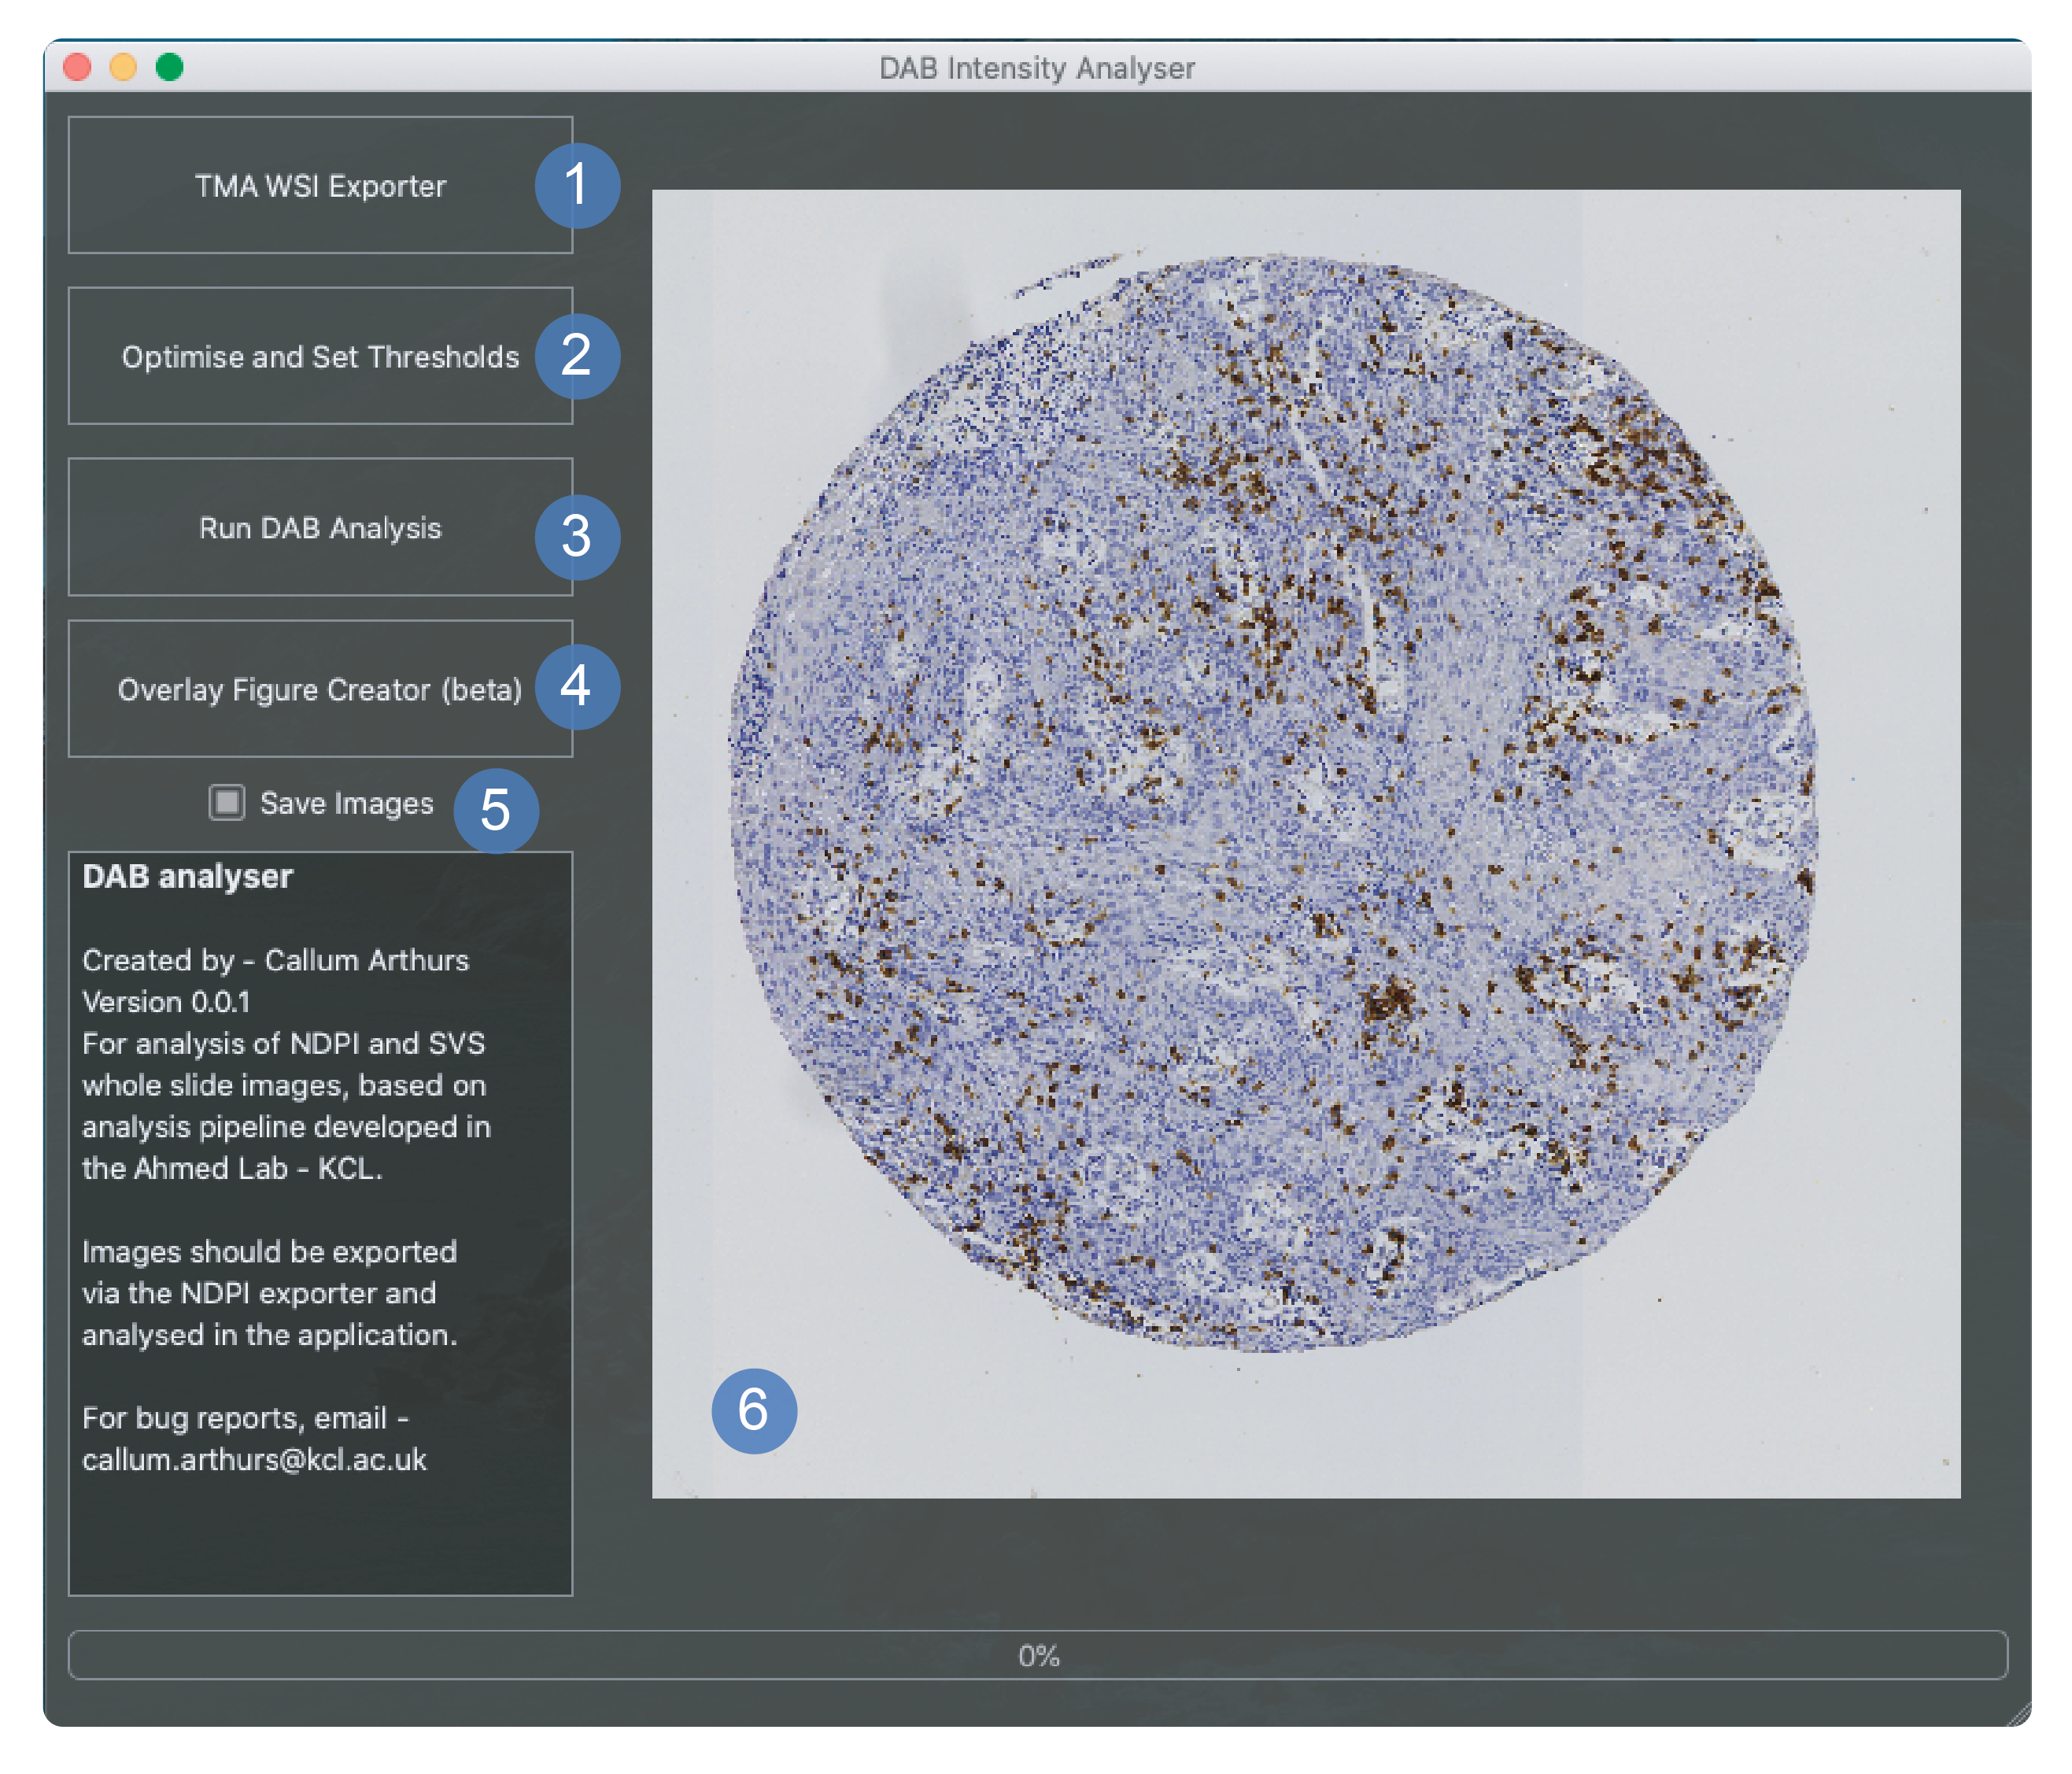
The button to launch the tissue array export window.
The button to launch the threshold selector window shown above. This should be used to apply new thresholds before chromogen analysis takes place. The button will turn green once this has been set.
Run dab analysis will launch a file selection window where the directory containing the whole dataset of images should be selected. This will begin the chromogen analysis process.
This is currently a way to overlay figures of the threshold over the image in a green overlay.
This can be toggled to the off position if the user would rather that mask images were not saved as a part of the chromogen analysis process.
Main window that displays images during analysis only. It shows first the core image and then the thresholded image at a low resolution.